7. TOARgridding
The TOARgridding projects data from the TOAR-II database onto a grid. The user can select the
variable,
statistical aggregation,
time period,
rectangular lat-lon grid of custom resolution,
and (optional) filtering according to the station metadata. The results of the gridding are provided in netCDF format and easy to use for example with python’s xarray for subsequent processing and visualization by the user.
A possible visualization of a time point can look like this:

7.1. Access for anonymous users
Anonymous user can only download an example dataset.
7.2. Using TOARgridding
Opening the TOARgridding shows the following window for a logged in TOAR user:
 Here, you need to select the required parameters. Starting with the daterange by providing start and end day, a statistics for the analysis and one of the three sampling strategies (daily, monthly, yearly).
For more details on the possible statistical analysis click the little “i” to be redirected to the documentation.
Here, you need to select the required parameters. Starting with the daterange by providing start and end day, a statistics for the analysis and one of the three sampling strategies (daily, monthly, yearly).
For more details on the possible statistical analysis click the little “i” to be redirected to the documentation.
The Flags field refers to the data quality flags. We use “all OK” as a default value, which request our internal quality checks to be passed for each value. For more details you can simply click the little “i” to open the documentation in a separate tab of your browser.
The gridded products always cover the full Earth divided by regular lat-lon grid. You can select the resolution for latitude and longitude in floating point numbers. The little arrows at the fields allow to change the resolutions in 1° steps. Typing allows the selection of floating point numbers. The gridding might afterwards slightly change the resolution to achieve equidistant grid cell sizes in both directions. For example a resolution of 1.9° for the latitude will create 95 cells with a resolution of about 1.89°.
The variable allows to select any of the variables stored within the TOAR-II database. Please be reminded that not all stations have a timeseries for each variable.
The data aggregation mode offers three choices for the processing of the timeseries data at a single station before creating the gridded product:
no aggregation
mean TS by station
merged TS
As described in the technical guide on data processing Chapter Three: The TOAR data processing workflow, a station can have several timeseries, include two or more timeseries for the same variable. This can be the case for different instruments measuring the same variables or through a timeseries being distributed over different networks, like national and European institutions.
The gridding always calculates the mean for all values within a grid cell. Having more than one timeseries located at a station can lead to an imbalance in the statistical weights. The option mean TS by station takes the results of the analysis service and calculates the mean value for all time series at a single station. The merged TS option does it the other way around: The timeseries at a single station are merged into a single timeseries before the statistical analysis is done.
Please be aware, that not all combinations of sampling, statistics and data aggregation mode create useful quantities.
To filter the data used in the calculation, click on the ‘Filter (1)’ button.
This opens the same ‘Filter’ modal as if it had been invoked from the centre of the top of the dashboard (see ‘Filtering’).
The number of currently active filters is indicated in brackets after the word ‘Filters’. Filtering is useful for limiting the amount of data used in gridding, since different user roles (anonymous user, registered user, TOAR user and power user) are associated with different restrictions and permissions (see ‘Registration’), and some calculations should be divided into smaller subtasks for performance reasons.
Filling out the fields will lead to the calculation of the required TOAR Billing Units (TBU):

The bottom row gives an information on the size of this request, the monthly limits and the confirm button to submit the request. The TBU fields have mouse over tool tips providing more details on the billing.
After submitting the request, the query for the request will be displayed in an extension of the previous window.
 The request can be used by developers who want to programmatically access the data rather than just using the visual interface.
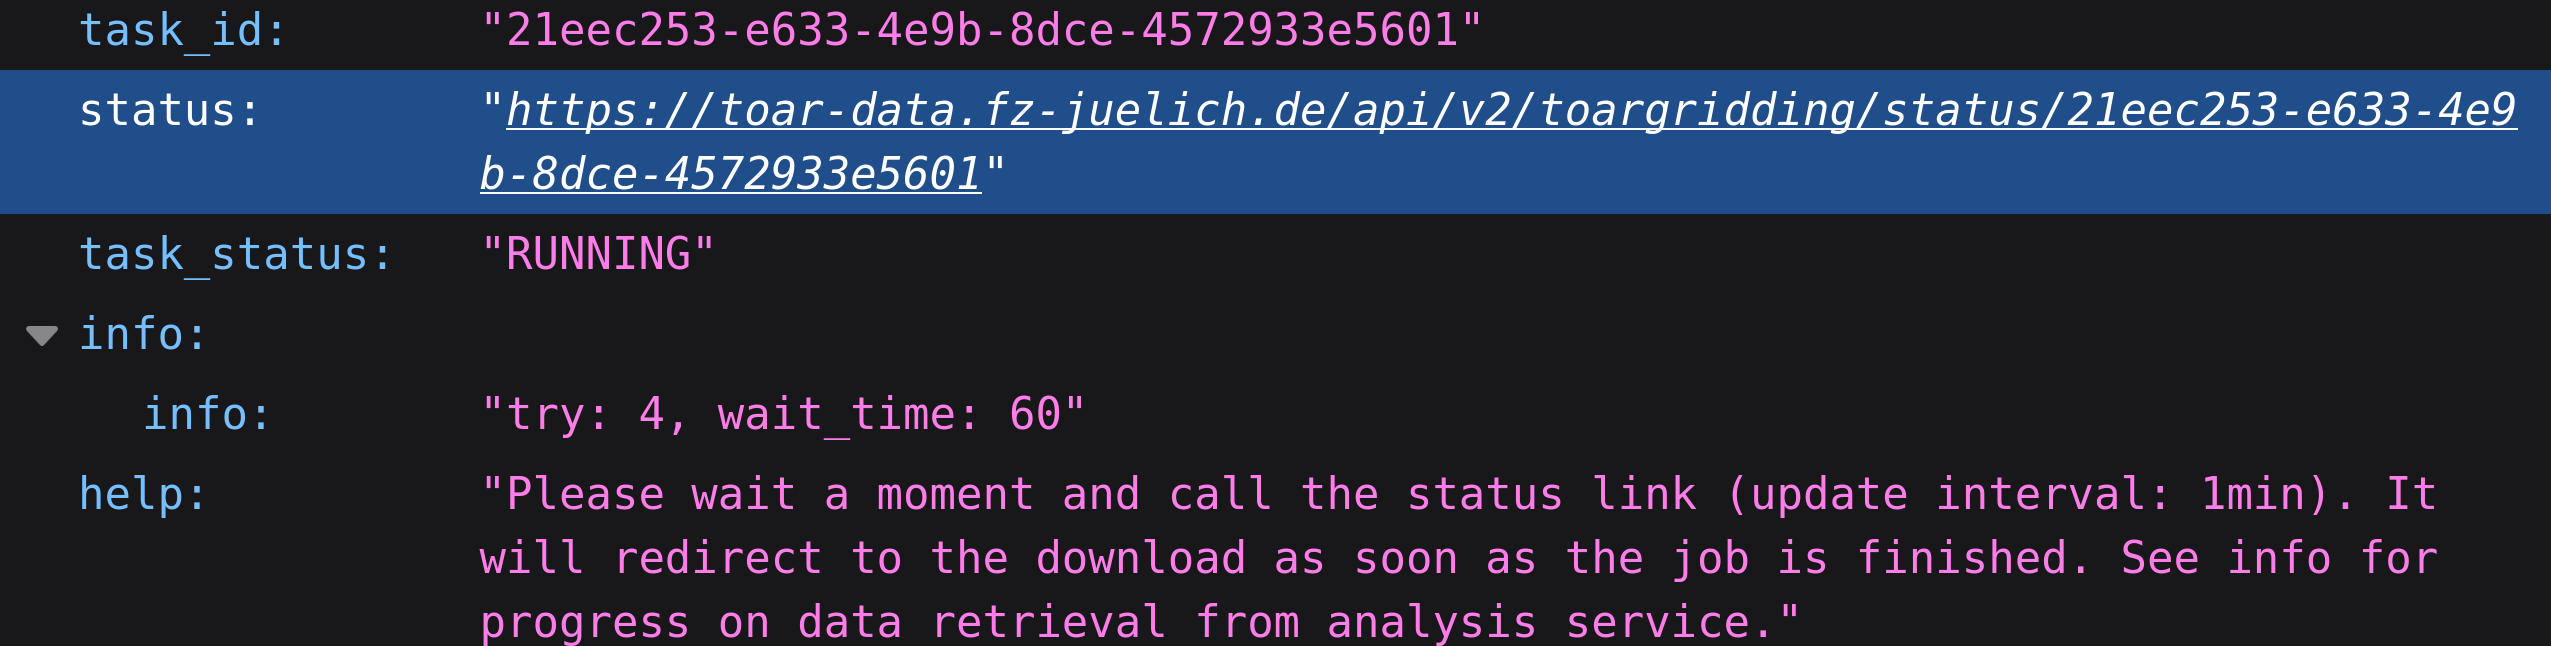
The results of the request can be accessed through the clickable status link. This link is also stored in the user profile of the dashboard.
The request can be used by developers who want to programmatically access the data rather than just using the visual interface.
The results of the request can be accessed through the clickable status link. This link is also stored in the user profile of the dashboard.
The status is the result of the underling service and served in JSON format. Opening the link will display the content and give information on the status of the job. As soon as the processing is finished, it will redirect to the download of the results.
7.3. Filtering for TOARGridding
The details on the filtering have been described in a previous section. We pass all filters as additional metadata. It is important to note, that TOARgridding ignores filters that conflict with its own required parameters, e.g. selecting variables in the “filter stations” is ignored. The same is true for the daterange.
One important filter we wish to highlight is the data origin type, which can be either model, measurement or both. The default value is both. There is also a limited number of timeseries that provide modeled TROPESS values for ozone. On the other hand other timeseries contain ERA5 data. We strongly recommend to explicitly set this filter.
7.4. Resulting datasets
The resulting datasets are provided in netCDF following the CF-convention. The metadata of the dataset include a large number of information, including the used requests and filtered metadata.
One important point are the contributors, which are provided through a link. This contains a list of all programs, institutions and persons contributing to this data product.
7.5. Additional Resource:
We offer TOARgridding as a project on our gitlab. It can be used as an offline package. This still requires access to the TOAR database for downloading the required statistical aggregates through the analysis service.
The documentation of the REST interface can be found at here.