4. Metadata Reference
The following sub sections describe the metadata of the TOAR V2 database following the structure of high-level criteria of FAIR data management. For a detailed description of metadata attributes of the individual database tables and a list of all controlled vocabulary definitions, see https://esde.pages.jsc.fz-juelich.de/toar-data/toardb_fastapi/docs/toardb_fastapi.html. There you will always find the up to date information.
4.1. Variables
While the main purpose of the TOAR V2 database is to provide ground-level ozone concentration time series, the database also contains data for several ozone precursor variables and meteorological information. Table 4.1 below provides a summary of the variables in the TOAR database including their short name, long name and physical units. Available variables can be queried as described in Section 3.2.4.
Variable Name |
Variable long name |
Units |
|---|---|---|
albedo |
albedo |
% |
aswdifu |
diffuse upward sw radiation |
W/m**2 |
aswdir |
direct downward sw radiation |
W/m**2 |
bc |
black carbon |
nmol mol-1 |
benzene |
benzene |
nmol mol-1 |
ch4 |
Methane |
nmol mol-1 |
cloudcover |
total cloud cover |
% |
co |
carbon monoxide |
nmol mol-1 |
ethane |
Ethane |
nmol mol-1 |
humidity |
atmospheric humidity |
g kg-1 |
irradiance |
global surface irradiance |
W m-2 |
mpxylene |
m,p-xylene |
nmol mol-1 |
no |
nitrogen monoxide |
nmol mol-1 |
no2 |
nitrogen dioxide |
nmol mol-1 |
nox |
reactive nitrogen oxides (NO+NO2) |
nmol mol-1 |
o3 |
ozone |
nmol mol-1 |
ox |
Ox |
nmol mol-1 |
oxylene |
o-xylene |
nmol mol-1 |
pblheight |
height of PBL |
m |
pm1 |
particles up to 1 µm diameter |
µg m-3 |
pm10 |
particles up to 10 µm diameter |
µg m-3 |
pm2p5 |
particles up to 2.5 µm diameter |
µg m-3 |
press |
atmospheric pressure |
hPa |
propane |
Propane |
nmol mol-1 |
relhum |
relative humidity |
% |
rn |
radon |
mBq m-3 |
so2 |
Sulphur dioxide |
nmol mol-1 |
temp |
atmospheric temperature |
degC |
toluene |
toluene |
nmol mol-1 |
totprecip |
total precipitation |
kg m-2 |
u |
u-component (zonal) of wind |
m s-1 |
v |
v-component (meridional) of wind |
m s-1 |
wdir |
wind direction |
degree |
wspeed |
wind speed |
m s-1 |
Within the TOAR V2 database we store the following information about each variable:
Variable Name: a short name to identify the variable (see Table 4.1, left column)
Variable long name: a more descriptive name of the variable (see Table 4.1, middle column)
Displayname: a variant of the variable name that is recommended for plotting
Cf_standardname: a standardized description of the variable quantity (see http://cfconventions.org/standard-names.html)
Units: a string defining the physical units in which the variable data are stored in the TOAR database. Note that we apply unit conversion in case we receive data in different units (see Table 4.1, right column)
Chemical_formula: variables which express mixing ratio or concentration values are sometimes named by their chemical formula and sometimes as clear names. This depends on common practice. This field will always contain the chemical formula of such variables (e.g. C6H6 for the variable benzene).
4.2. Station Characterisation
Air pollution levels are controlled by several factors. Among the most important factors are the proximity to emission sources and the geographic environment around a measurement site. As a user you may often want to stratify air pollution data with respect to certain site characteristics, e.g. „urban“ or „rural“. There are numerous ways in which environmental agencies around the world define metadata attributes to describe stations in a standardised way. However, these standardisations differ widely across regions. Furthermore, data contributed from individual research groups often do not follow the standardised terminology of environmental agencies, because the employed terms do not seem to be appropriate for the description of the specific site which is operated by the research group. The problem of labelling stations as “urban” or “rural” is quite complex as can be demonstrated with using population density as proxy. “Built-up areas” which constitute major cities in Europe may be regarded as relatively small villages in other parts of the world, e.g. in East Asia, South Asia, or Africa. Even if population density (and total number of people) in such a “village” in India, for example, may be much larger than in, say, a German city, the air pollutant emissions (with respect to ozone precursors at least) may be much greater in the small city compared to the large village. Therefore, the use of simple proxy variables will generally not lead to a meaningful separation between (ozone) air pollution regimes.
The TOAR database offers various ways for the characterisation of measurement stations and we try to harmonise the employed terminology to the extent possible. There are four different approaches to station characterisation implemented in the TOAR database and its corresponding web services. These are described below in the order of increasing complexity and decreasing level of harmonisation. For analyses supporting the TOAR-II assessment, we recommend the use of the TOAR station characterisation (Section 4.2.2), perhaps augmented with information from specific global metadata fields (Table 4.5) and, for individual sites and where available, with detailed station descriptions (Section 4.2.5).
4.2.1. Station Location
The locations of measurement sites are stored in the TOAR database with at least 4 decimals. In theory, this allows the pinpointing of stations within 12 m or less. However, in reality, the coordinates may not be as precise as this, because the inlet of the air quality measurements may be located away from the station building, or station locations have been reported with wrong or imprecise coordinates. We therefore perform some coordinate validation of the metadata in the TOAR database (details given in 1 ) and document any changes that are applied to station coordinates in the metadata changelog (see Section 4.3.2).
Geographical coordinates are saved as a PostGIS POINT location with lat and lon given in degrees_north and degrees_east, respectively, using the World Geodetic System (WGS) 84 coordinate reference system. Station altitudes are given in metres. Note that the station altitude value refers to the ground-level altitude of the measurement site. Air sampling inlets are typically at 10-15 m above ground. Where available, the sampling height is stored in the metadata of each measurand’s time series as the sampling heights may differ between species.
Name**|”**Description” |
|
|---|---|
country |
The country, where the station resides, or which operates the station (e.g. in Antarctica) (see controlled vocabulary: Country Code) |
state |
The state or province, where the station resides |
timezone |
Station timezone (see controlled vocabulary: Timezone) |
4.2.2. TOAR Station Characterisation
In a new study, “TOAR-classifier v2: A data-driven classification tool for global air quality stations”, Mache et al. (2025) introduces a machine-learning (ML) approach that takes a fresh, objective look at this long-standing problem. Rather than treating the station types supplied by the data provider as a fixed truth, their method uses TOAR station metadata to make classification assumptions explicit, quantify uncertainty, and deliver a ready-to-use tool in TOAR-II ozone assessments and beyond.
With this approach, the values ‘urban’, ‘suburban’ and ‘rural’ are assigned to ‘toar2_category’, as these are also supplied by the data providers as station types, but using an objective method.
4.2.3. European Station Characterisation Scheme
Since 2018, the rules for reporting air quality data including the metadata describing the site locations, have been laid out in the “Member States’ and European Commission’s Common Understanding of the Commission Implementing Decision laying down rules for Directives 2004/107/EC and 2008/50/EC of the European Parliament and of the Council as regards the reciprocal exchange of information and reporting on ambient air 2 ”. Annex II of this document describes the terms used in the European air quality database (Airbase).
station_type**|”**description” |
|
|---|---|
Traffic |
Located in close proximity to a single major road.
|
Industrial |
Located in close proximity to a single industrial source or industrial area.
A wide range of industrial sources can be considered here, including
- thermal power generation
- district heating plants
- refineries
- waste incineration/treatment plants, dump sites
- mining, including gravel, oil, natural gas
- airports
- ports.
|
Background |
Any location with is neither to be classified as “traffic” or “industrial”. Located such that its pollution levels are representative of the average exposure of the general population (or vegetation and natural ecosystems) within the type of area under assessment. The pollution level should not be dominated by a single source type (e.g. traffic), unless that source type is typical within the area under assessment. The station should usually be representative of a wider area of at least several square kilometres.
|
station_type_of_area |
description |
|---|---|
urban |
Continuously built-up urban area meaning complete (or at least highly
predominant) building-up of the street front side by buildings with at least
two floors or large detached buildings with at least two floors. With the
exception of city parks, large railway stations, urban motorways and motorway
junctions, the built-up area is not mixed with non-urbanised areas.
|
suburban |
Largely built-up urban area.
‘Largely built-up’ means contiguous settlement of detached buildings of any
size with a building density less than for ‘continuously built-up’ area.
The built-up area is mixed with non-urbanised areas (e.g. agricultural,
lakes, woods). It must also be noted that ‘suburban’ as defined here has a
different meaning than in every day English i.e. ‘an outlying part of a city
or town’ suggesting that a suburban area is always associated to an urban
area. In our context, a suburban area can be suburban on its own without
any urban part.
|
rural |
All areas, that do not fulfil the criteria for urban or suburban areas, are
defined as “rural” areas. There are three subdivisions in this category to
indicate the distance to the nearest built-up urban area:
* Rural – near city:
area within 10 km from the border of an urban or suburban area;
* Rural – regional:
10-50 km from major sources/source areas;
* Rural - remote:
> 50 km from major sources/source areas.
|
While the use of these categories may be useful for the analysis of European air quality data, we note that non-European data providers generally use different categories and definitions to label their measurement sites. While we try to harmonize the values of this attribute, these labels remain somewhat subjective for non-European data.
4.2.4. Station Characterisation Through Geospatial Data
The “toar2_category” (Section 4.2.2) offers an easy-to-use classification scheme that can be universally applied to air quality stations worldwide. Often, this crude classification will be insufficient to capture important air pollution features at specific site types so that typical statistical properties of air quality time series from such sites will get lost in the mixture of sites subsumed in the broader classification. For example, coastal and island sites often exhibit typical diurnal cycles of ozone concentrations which differ markedly from stations further inland.
To allow for more refined analyses of air quality data, version 2 of the TOAR database offers an extended variety of metadata elements to characterize stations. These metadata elements have been derived from several geospatial datasets at spatial resolutions from 90 m to 10 km. As air quality data analyst you may often be more interested in the area around a measurement station than in the geospatial properties at the site location itself. Therefore, in addition to the pixel value at the location of the measurement site, we often provide aggregated values of the geospatial data within distances of 5 and 25 km to the site location. The aggregation method depends on the geospatial field. For example, we will report “max_population_density_25km_year2015” and “mean_nightlights_5km_year2013”.
Table 4.5 lists the geospatial field names, that are available for the TOAR station characterisation. Detailed descriptions and service URLs can be found at https://esde.pages.jsc.fz-juelich.de/toar-data/toardb_fastapi/docs/toardb_fastapi.html#stationmetaglobal and https://esde.pages.jsc.fz-juelich.de/toar-data/toardb_fastapi/docs/toardb_fastapi.html#geopeas-urls respectively.
Name**|”**Type”|”Description” |
||
|---|---|---|
mean_srtm_alt_90m_year1994 |
number |
mean value within a radius of 90 m around station location of the following data of the year 1994: {‘units’: ‘m’, ‘data_source’: ‘NASA Shuttle Radar Topographic Mission (SRTM)’, ‘citation’: ‘Jarvis, A., H.I. Reuter, A. Nelson, E. Guevara, 2008, Hole-filled SRTM for the globe Version 4, available from the CGIAR-CSI SRTM 90m Database (http://srtm.csi.cgiar.org).’} |
mean_srtm_alt_1km_year1994 |
number |
mean value within a radius of 1 km around station location of the following data of the year 1994: {‘units’: ‘m’, ‘data_source’: ‘NASA Shuttle Radar Topographic Mission (SRTM)’, ‘citation’: ‘Jarvis, A., H.I. Reuter, A. Nelson, E. Guevara, 2008, Hole-filled SRTM for the globe Version 4, available from the CGIAR-CSI SRTM 90m Database (http://srtm.csi.cgiar.org).’} |
max_srtm_relative_alt_5km_year1994 |
number |
maximum value within a radius of 5 km around station location with relative altitude of the following data of the year 1994: {‘units’: ‘m’, ‘data_source’: ‘NASA Shuttle Radar Topographic Mission (SRTM)’, ‘citation’: ‘Jarvis, A., H.I. Reuter, A. Nelson, E. Guevara, 2008, Hole-filled SRTM for the globe Version 4, available from the CGIAR-CSI SRTM 90m Database (http://srtm.csi.cgiar.org).’} |
min_srtm_relative_alt_5km_year1994 |
number |
minimum value within a radius of 5 km around station location with relative altitude of the following data of the year 1994: {‘units’: ‘m’, ‘data_source’: ‘NASA Shuttle Radar Topographic Mission (SRTM)’, ‘citation’: ‘Jarvis, A., H.I. Reuter, A. Nelson, E. Guevara, 2008, Hole-filled SRTM for the globe Version 4, available from the CGIAR-CSI SRTM 90m Database (http://srtm.csi.cgiar.org).’} |
stddev_srtm_relative_alt_5km_year1994 |
number |
standard deviation within a radius of 5 km around station location with relative altitude of the following data of the year 1994: {‘units’: ‘m’, ‘data_source’: ‘NASA Shuttle Radar Topographic Mission (SRTM)’, ‘citation’: ‘Jarvis, A., H.I. Reuter, A. Nelson, E. Guevara, 2008, Hole-filled SRTM for the globe Version 4, available from the CGIAR-CSI SRTM 90m Database (http://srtm.csi.cgiar.org).’} |
climatic_zone_year2016 |
string |
value for the year 2016 of the following data: {‘units’: ‘None’, ‘data_source’: ‘University of East Anglia Climatic Research Unit; Harris, I.C.; Jones, P.D. (2017): CRU TS4.00: Climatic Research Unit (CRU) Time-Series (TS) version 4.00 of high-resolution gridded data of month-by-month variation in climate (Jan. 1901- Dec. 2015). Centre for Environmental Data Analysis, 25 August 2017 (http://dx.doi.org/10.5285/edf8febfdaad48abb2cbaf7d7e846a86)’, ‘citation’: ‘University of East Anglia Climatic Research Unit; Harris, I.C.; Jones, P.D. (2017): CRU TS4.00: Climatic Research Unit (CRU) Time-Series (TS) version 4.00 of high-resolution gridded data of month-by-month variation in climate (Jan. 1901- Dec. 2015). Centre for Environmental Data Analysis, 25 August 2017 (http://dx.doi.org/10.5285/edf8febfdaad48abb2cbaf7d7e846a86)’} (see controlled vocabulary: Climatic Zone 2019) |
htap_region_tier1_year2010 |
string |
value for the year 2010 of the following data: The ‘tier1’ region defined in the task force on hemispheric transport of air pollution (TFHTAP) coordinated model studies according to figure 4 of https://publications.jrc.ec.europa.eu/repository/bitstream/JRC102552/lbna28255enn.pdf (see controlled vocabulary: Station HTAP Region) |
dominant_landcover_year2012 |
string |
value for the year 2012 of the following data: {‘units’: ‘no unit’, ‘data_source’: ‘ESA 2017 and UCLouvain’, ‘citation’: ‘ESA. Land Cover CCI Product User Guide Version 2. Tech. Rep. (2017). Available at: http://maps.elie.ucl.ac.be/CCI/viewer/download/ESACCI-LC-Ph2-PUGv2_2.0.pdf’} (see controlled vocabulary: Station Landcover Type) |
landcover_description_year2012 |
string |
description of the values for the year 2012 within a radius of 25 km around station location of the following data: {‘units’: ‘no unit’, ‘data_source’: ‘ESA 2017 and UCLouvain’, ‘citation’: ‘ESA. Land Cover CCI Product User Guide Version 2. Tech. Rep. (2017). Available at: http://maps.elie.ucl.ac.be/CCI/viewer/download/ESACCI-LC-Ph2-PUGv2_2.0.pdf’} (see controlled vocabulary: Station Landcover Type) |
dominant_ecoregion_year2017 |
string |
value for the year 2017 of the following data: {‘units’: ‘None’, ‘data_source’: ‘RESOLVE Biodiversity and Wildlife Solutions’, ‘citation’: ‘Eric Dinerstein, David Olson, Anup Joshi, Carly Vynne, Neil D. Burgess, Eric Wikramanayake, Nathan Hahn, Suzanne Palminteri, Prashant Hedao, Reed Noss, Matt Hansen, Harvey Locke, Erle C Ellis, Benjamin Jones, Charles Victor Barber, Randy Hayes, Cyril Kormos, Vance Martin, Eileen Crist, Wes Sechrest, Lori Price, Jonathan E. M. Baillie, Don Weeden, Kieran Suckling, Crystal Davis, Nigel Sizer, Rebecca Moore, David Thau, Tanya Birch, Peter Potapov, Svetlana Turubanova, Alexandra Tyukavina, Nadia de Souza, Lilian Pintea, Jose C. Brito, Othman A. Llewellyn, Anthony G. Miller, Annette Patzelt, Shahina A. Ghazanfar, Jonathan Timberlake, Heinz Klöser, Yara Shennan-Farpon, Roeland Kindt, Jens-Peter Barnekow Lilleso, Paulo van Breugel, Lars Graudal, Maianna Voge, Khalaf F. Al-Shammari, Muhammad Saleem, An Ecoregion-Based Approach to Protecting Half the Terrestrial Realm, BioScience, Volume 67, Issue 6, June 2017, Pages 534–545, https://doi.org/10.1093/biosci/bix014’} (see controlled vocabulary: Station ECO Region Type) |
ecoregion_description_year2017 |
string |
description of the values for the year 2017 within a radius of 25 km around station location of the following data: {‘units’: ‘None’, ‘data_source’: ‘RESOLVE Biodiversity and Wildlife Solutions’, ‘citation’: ‘Eric Dinerstein, David Olson, Anup Joshi, Carly Vynne, Neil D. Burgess, Eric Wikramanayake, Nathan Hahn, Suzanne Palminteri, Prashant Hedao, Reed Noss, Matt Hansen, Harvey Locke, Erle C Ellis, Benjamin Jones, Charles Victor Barber, Randy Hayes, Cyril Kormos, Vance Martin, Eileen Crist, Wes Sechrest, Lori Price, Jonathan E. M. Baillie, Don Weeden, Kieran Suckling, Crystal Davis, Nigel Sizer, Rebecca Moore, David Thau, Tanya Birch, Peter Potapov, Svetlana Turubanova, Alexandra Tyukavina, Nadia de Souza, Lilian Pintea, Jose C. Brito, Othman A. Llewellyn, Anthony G. Miller, Annette Patzelt, Shahina A. Ghazanfar, Jonathan Timberlake, Heinz Klöser, Yara Shennan-Farpon, Roeland Kindt, Jens-Peter Barnekow Lilleso, Paulo van Breugel, Lars Graudal, Maianna Voge, Khalaf F. Al-Shammari, Muhammad Saleem, An Ecoregion-Based Approach to Protecting Half the Terrestrial Realm, BioScience, Volume 67, Issue 6, June 2017, Pages 534–545, https://doi.org/10.1093/biosci/bix014’} (see controlled vocabulary: Station ECO Region Type) |
distance_to_major_road_year2020 |
number |
value for the year 2020 of the following data: {‘version’: 0.6, ‘generator’: ‘Overpass API 0.7.55.9 ab41fea6’, ‘copyright’: ‘https://www.openstreetmap.org/copyright’, ‘timestamp’: ‘’} |
mean_nightlight_1km_year2013 |
number |
mean value within a radius of 1 km around station location of the following data of the year 2013: {‘units’: ‘None’, ‘data_source’: ‘NOAA National Centers for Environmental Information (NCEI)’, ‘citation’: ‘None’} |
mean_nightlight_5km_year2013 |
number |
mean value within a radius of 5 km around station location of the following data of the year 2013: {‘units’: ‘None’, ‘data_source’: ‘NOAA National Centers for Environmental Information (NCEI)’, ‘citation’: ‘None’} |
max_nightlight_25km_year2013 |
number |
maximum value within a radius of 5 km around station location of the following data of the year 2013: {‘units’: ‘None’, ‘data_source’: ‘NOAA National Centers for Environmental Information (NCEI)’, ‘citation’: ‘None’} |
max_nightlight_25km_year1992 |
number |
maximum value within a radius of 25 km around station location of the following data of the year 2013: {‘units’: ‘None’, ‘data_source’: ‘NOAA National Centers for Environmental Information (NCEI)’, ‘citation’: ‘None’} |
mean_population_density_250m_year2015 |
number |
mean value within a radius of 250 m around station location of the following data of the year 2015: {‘data_source’: ‘The European Commission, Joint Research Centre’, ‘citation’: ‘Schiavina, Marcello; Freire, Sergio; MacManus, Kytt (2019): GHS-POP R2019A - GHS population grid multitemporal (1975-1990-2000-2015). European Commission, Joint Research Centre (JRC) [Dataset] doi:10.2905/0C6B9751-A71F-4062-830B-43C9F432370F PID: http://data.europa.eu/89h/0c6b9751-a71f-4062-830b-43c9f432370f’} |
mean_population_density_5km_year2015 |
number |
mean value within a radius of 5 km around station location of the following data of the year 2015: {‘data_source’: ‘The European Commission, Joint Research Centre’, ‘citation’: ‘Schiavina, Marcello; Freire, Sergio; MacManus, Kytt (2019): GHS-POP R2019A - GHS population grid multitemporal (1975-1990-2000-2015). European Commission, Joint Research Centre (JRC) [Dataset] doi:10.2905/0C6B9751-A71F-4062-830B-43C9F432370F PID: http://data.europa.eu/89h/0c6b9751-a71f-4062-830b-43c9f432370f’} |
max_population_density_25km_year2015 |
number |
maximum value within a radius of 25 km around station location of the following data of the year 2015: {‘data_source’: ‘The European Commission, Joint Research Centre’, ‘citation’: ‘Schiavina, Marcello; Freire, Sergio; MacManus, Kytt (2019): GHS-POP R2019A - GHS population grid multitemporal (1975-1990-2000-2015). European Commission, Joint Research Centre (JRC) [Dataset] doi:10.2905/0C6B9751-A71F-4062-830B-43C9F432370F PID: http://data.europa.eu/89h/0c6b9751-a71f-4062-830b-43c9f432370f’} |
mean_population_density_250m_year1990 |
number |
human population on a square of 250 m for the year 1990 (residents km-2) |
mean_population_density_5km_year1990 |
number |
mean value within a radius of 250 m around station location of the following data of the year 1990: {‘data_source’: ‘The European Commission, Joint Research Centre’, ‘citation’: ‘Schiavina, Marcello; Freire, Sergio; MacManus, Kytt (2019): GHS-POP R2019A - GHS population grid multitemporal (1975-1990-2000-2015). European Commission, Joint Research Centre (JRC) [Dataset] doi:10.2905/0C6B9751-A71F-4062-830B-43C9F432370F PID: http://data.europa.eu/89h/0c6b9751-a71f-4062-830b-43c9f432370f’} |
max_population_density_25km_year1990 |
number |
maximum value within a radius of 25 km around station location of the following data of the year 1990: {‘data_source’: ‘The European Commission, Joint Research Centre’, ‘citation’: ‘Schiavina, Marcello; Freire, Sergio; MacManus, Kytt (2019): GHS-POP R2019A - GHS population grid multitemporal (1975-1990-2000-2015). European Commission, Joint Research Centre (JRC) [Dataset] doi:10.2905/0C6B9751-A71F-4062-830B-43C9F432370F PID: http://data.europa.eu/89h/0c6b9751-a71f-4062-830b-43c9f432370f’} |
mean_nox_emissions_10km_year2015 |
number |
mean value within a radius of 10 km around station location of the following data of the year 2015: {‘units’: ‘kg m-2 s-1’, ‘data_source’: ‘https://atmosphere.copernicus.eu/sites/default/files/2019-06/cams_emissions_general_document_apr2019_v7.pdf’, ‘citation’: “Granier, C., S. Darras, H. Denier van der Gon, J. Doubalova, N. Elguindi, B. Galle, M. Gauss, M. Guevara, J.-P. Jalkanen, J. Kuenen, C. Liousse, B. Quack, D. Simpson, K. Sindelarova The Copernicus Atmosphere Monitoring Service global and regional emissions (April 2019 version) Report April 2019 version null 2019 Elguindi, Granier, Stavrakou, Darras et al. Analysis of recent anthropogenic surface emissions from bottom-up inventories and top-down estimates: are future emission scenarios valid for the recent past? Earth’s Future null submitted 2020”} |
mean_nox_emissions_10km_year2000 |
number |
mean value within a radius of 10 km around station location of the following data of the year 2000: {‘units’: ‘kg m-2 s-1’, ‘data_source’: ‘https://atmosphere.copernicus.eu/sites/default/files/2019-06/cams_emissions_general_document_apr2019_v7.pdf’, ‘citation’: “Granier, C., S. Darras, H. Denier van der Gon, J. Doubalova, N. Elguindi, B. Galle, M. Gauss, M. Guevara, J.-P. Jalkanen, J. Kuenen, C. Liousse, B. Quack, D. Simpson, K. Sindelarova The Copernicus Atmosphere Monitoring Service global and regional emissions (April 2019 version) Report April 2019 version null 2019 Elguindi, Granier, Stavrakou, Darras et al. Analysis of recent anthropogenic surface emissions from bottom-up inventories and top-down estimates: are future emission scenarios valid for the recent past? Earth’s Future null submitted 2020”} |
toar1_category |
string |
The station classification for the Tropsopheric Ozone Assessment Report based on the station proxy data that are stored in the TOAR database (see controlled vocabulary: Station TOAR Category) |
toar2_category |
string |
The station classification for the Tropsopheric Ozone Assessment Report phase 2 based on a machine‑learning derived classification (‘The TOAR-classifier v2’; Mache et al., 2025) are stored in the TOAR database (see controlled vocabulary: Station Type Of Area) |
Note that the geospatial data that are incorporated in the TOAR database may not always be accurate at the local scale. Most of these data have been derived from satellite measurements of various physical properties (e.g. reflectance) of the Earth surface, and measurement errors or imperfect retrieval algorithms may lead to occasional errors. Note also that the “geospatial settings” around a measurement station can change with time. For example, in rapidly developing regions a station which had been located in a rural setting when it was established might be completely surrounded by buildings and roads a few years later. We therefore store geospatial data of different years in our backend services and in some cases we calculate the metadata values for at two different years, so that you can use this information as an indication for the change in the drivers of air pollution trends.
4.2.5. Individual Station Description
While the station information provided through methods 1-3 (Section 4.2.1 to Section 4.2.3) is largely consistent across the globe, there may be additional, relevant information about measurement sites that cannot be captured by the metadata elements described so far. For this reason, the TOAR V2 database allows storage of additional information which can help to characterise a measurement station and thus guide the analysis of air pollution data from that site.
Three types of auxiliary data can be submitted to the TOAR data centre as supporting information about stations:
URLs to web sites with detailed station information,
StationmetaAuxDoc - PDF documents with station descriptions (any language, but English would be preferred),
Photographs of the station buildings and facilities.
Download links for this information can be obtained together with all other station metadata from the REST API query stationmeta (see Section 3.2.1).
Finally, any other information about a station can be provided in the form of a structured JSON string (“additional_metadata” field). This feature is used to capture station metadata information from different data providers which cannot be mapped directly to the metadata fields defined in the TOAR database. Such information is extracted from the submitted data files when the data are uploaded into the database. We ask data providers to begin such metadata elements with “station_” (see TOAR Data Submission Format). An example is given below.
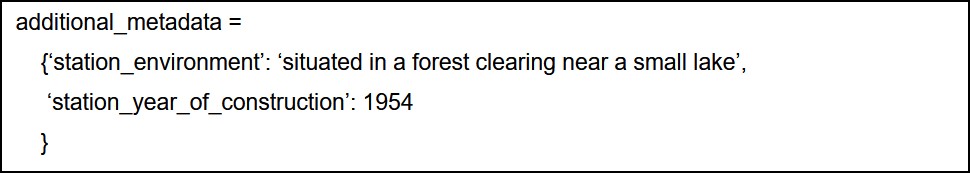
Fig. 4.1 Example of additional station metadata elements as they can be extracted from submitted data files
4.3. Provenance Information
Provenance is the chronology of the ownership, custody or location of a historical object (Wikipedia, 2021, citing the Oxford English Dictionary). In FAIR data management, provenance is important to trace the ownership of a data record and possible modifications which were applied to data and metadata after the data record has been created. Ideally, all data should have a complete track record from the measurement to the data analysis or visualisation in a scientific article, on a web page, etc. For air quality data, this is rarely possible up to now, because most data providers don’t maintain complete records of their data processing or because such records are not published in machine-readable digital format. In the TOAR database, we try to capture all provenance information that is made available to us by the data providers and we have implemented several measures to ensure that all modifications applied to data and metadata which we apply as part of the data curation process are captured and documented. This comprises the preservation of information about the institution and/or person who has done something with the data (so-called role codes), the archival of any changes applied to the metadata after initial screening of the data we receive 3 , a versioning scheme for data sets (i.e. time series), and the inclusion of provenance information in our data quality flags (see Section 5.1). The following sub sections describe these elements in more detail.
4.3.1. Role Codes
Different people and/or institutions are involved in the processing of a dataset from the original measurement to the provision of the data via files or a web service. Likewise, as part of the data curation performed at the TOAR data centre, some metadata elements or data values may be modified, for example in order to harmonize the metadata elements (“controlled vocabulary”), or during quality control of time series. Role codes define specific actions or responsibilities of people or organisations so that it becomes traceable who has done what with the data. The ISO19115 4 Standard defines a set of 20 role codes. We adopted a subset of these role codes for the TOAR database to maximize interoperability. However, as the definitions of the role codes provided by ISO are very abstract, we have extended the role codes table with our own definitions of the roles as we understand them in the context of air quality data management. Table 4.6 lists the role codes which are used in the TOAR database and their extended definition strings.
Role Code |
Role Code Definition |
|---|---|
Point of Contact |
Party who can be contacted for acquiring knowledge about or acquisition of the resource |
Principal Investigator |
Key party responsible for gathering information and conducting research. This is the person who is responsible for making the measurements and securing the quality of the data. In general, there should be exactly one Principal Investigator associated with every measurement and (a possibly different person) associated with a station. The Principal Investigator may delegate responsibilities, for example to technicians or postdoctoral researchers, and yet remain PrincipalInvestigator as the person overseeing the measurements and data distribution. |
Originator |
Party who created the resource. We use this role primarily for government data, where Principal Investigators are usually not defined. |
Contributor |
Party contributing to the resource. This role applies to any person who is involved in making the measurements or processing the data. Normally, the Principal Investigator will decide who shall be listed as contributor. |
Collaborator |
Party who assists with the generation of the resource other than the principal investigator. This can be a person who has been involved in making the measurements or processing the data, but who is either not part of the institution responsible for the measurement or who has “contributed” only temporarily. One situation we have encountered in TOAR, where nomination of collaborators makes sense is when university researchers assist government agencies in preparing their data for submission to the TOAR database. |
Resource Provider |
Party that supplies the resource. This role is assigned to government data obtained indirectly. For example, the data of the European Airbase originates from national environmental agencies, but the European Environmental Agency acts as Resource Provider. |
Custodian |
Party that accepts accountability and responsibility for the resource and ensures appropriate care and maintenance of the resource. This describes our responsibilities as TOAR data centre team. |
Stakeholder |
an individual or organization who has an interest in the resource and/or is affected by or affects the actions of the resource |
RightsHolder |
the individual or organization who has ownership of the legal right to the resource |
Roles are documented for station metadata and for time series metadata and data (Fig. 4.2). More than one role can be defined for each station or time series record. According to the ISO definition, role codes can be assigned to an institution or to a person or to both. In the TOAR database this is handled via the generic Contact model, which has one field for person and one field for organisation. Fig. 4.3 provides an example for the definition of roles in the metadata of an ozone measurement time series.
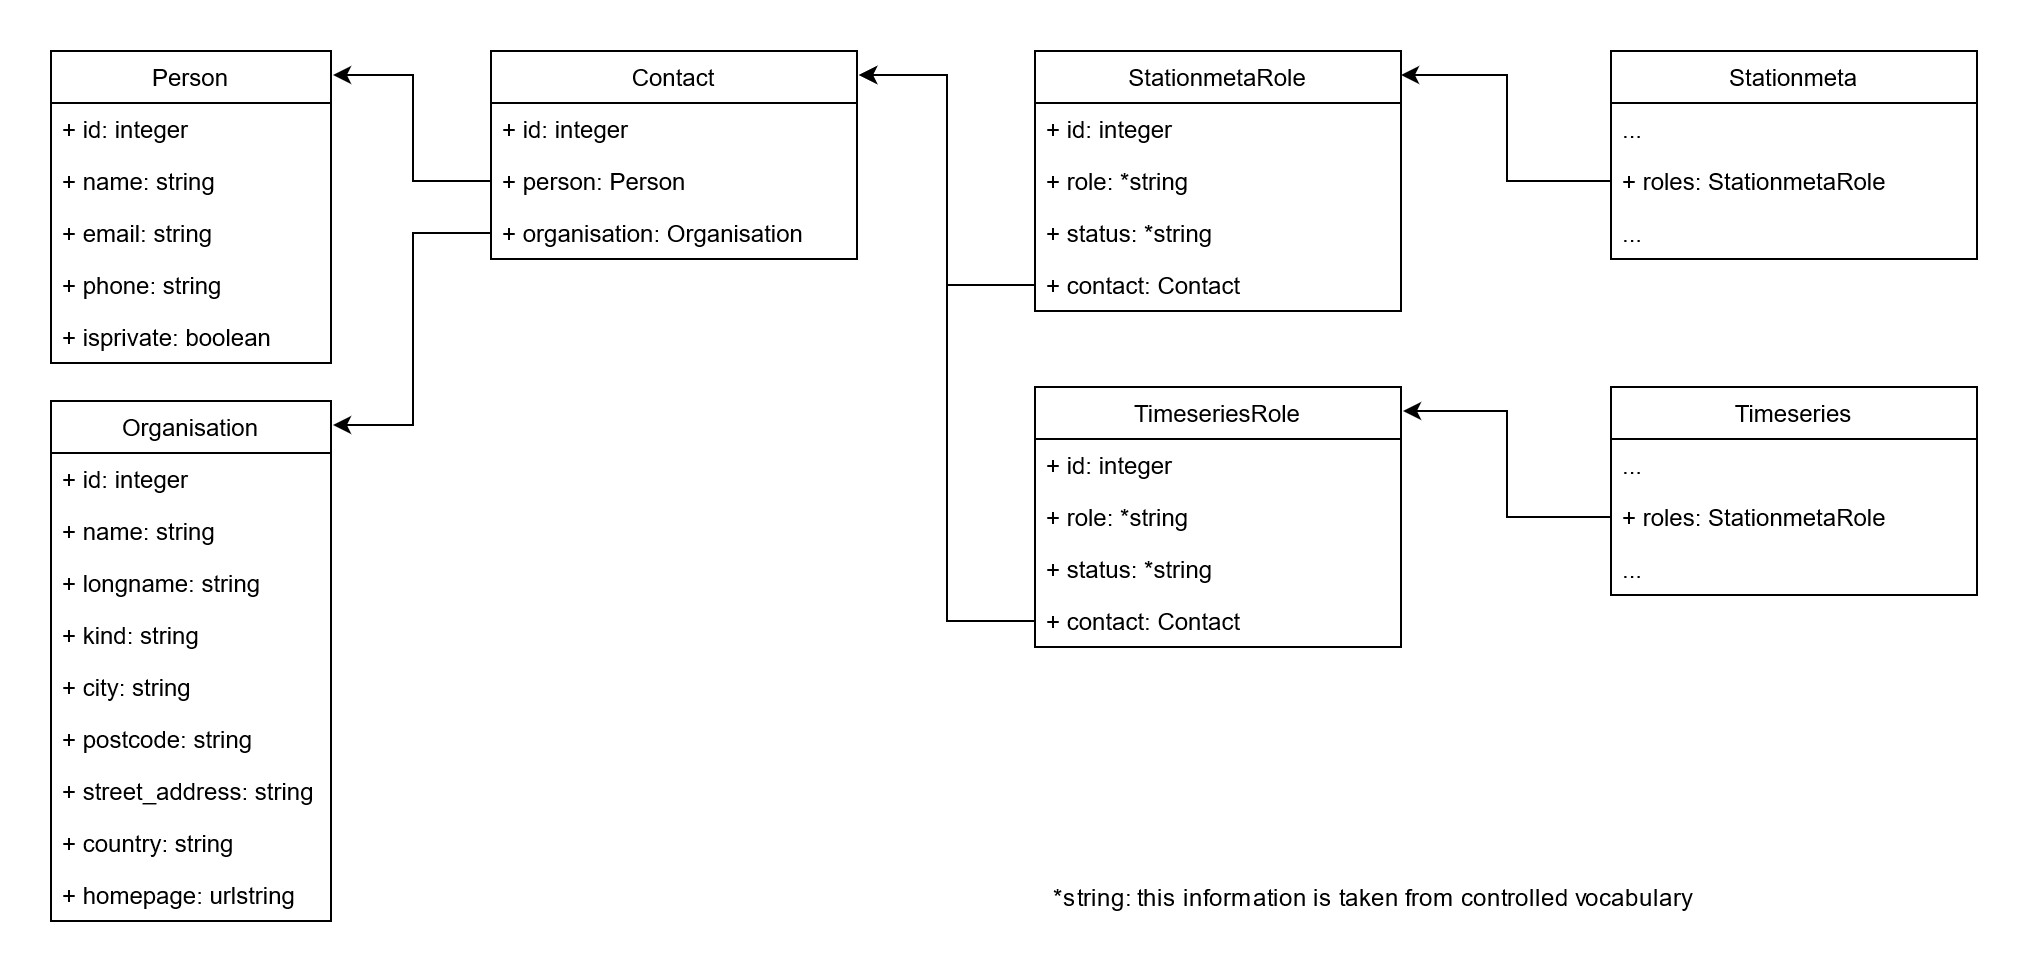
Fig. 4.2 TOAR database model for recording roles of people and organisations in the data creation and curation process
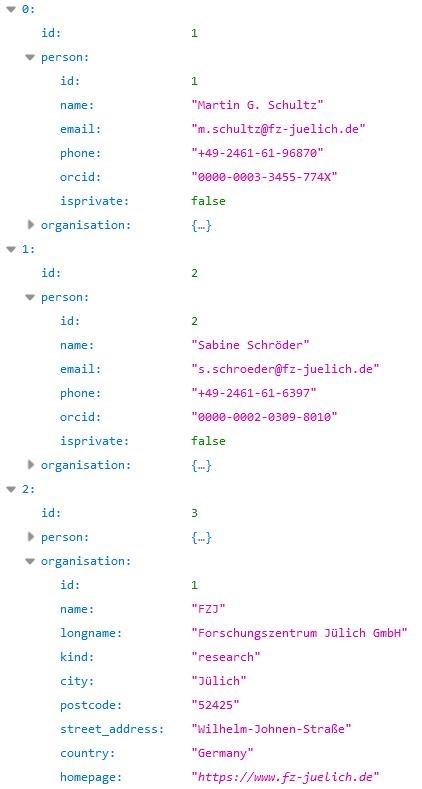
Fig. 4.3 Example metadata describing the roles of people and organisations involved in the creation and storage of an ozone time series from the German Umweltbundesamt
4.3.2. Metadata Change Logs
All station and time series metadata records are associated with a changelog table which may contain 1..N change records for every specific station and timeseries entry preserving any modifications applied to the metadata. Figure 5 shows the structure of the StationmetaChangelog and TimeseriesChangelog records. Both structures record the date and time when the modification was made, a free text description of the applied change, a JSON formatted string with the old and new values, a reference to the station or time series, the numerical id of the author who applied the change, and a change type field, which uses controlled vocabulary (see Table 4.7). The changelog of a time series is not only used to save modifications of the metadata, but they normally also contain a summary of modifications applied to the data values of this time series. Exceptions are made for near realtime data streams where new data records are not monitored via the changelog mechanism to avoid the excessive creation of trivial metadata. To allow for the tracking of data changes, the TimeseriesChangelog structure contains the additional fields period_start, period_end, and version. The latter refers to the version number after the change has been applied (see Section 4.3.3).
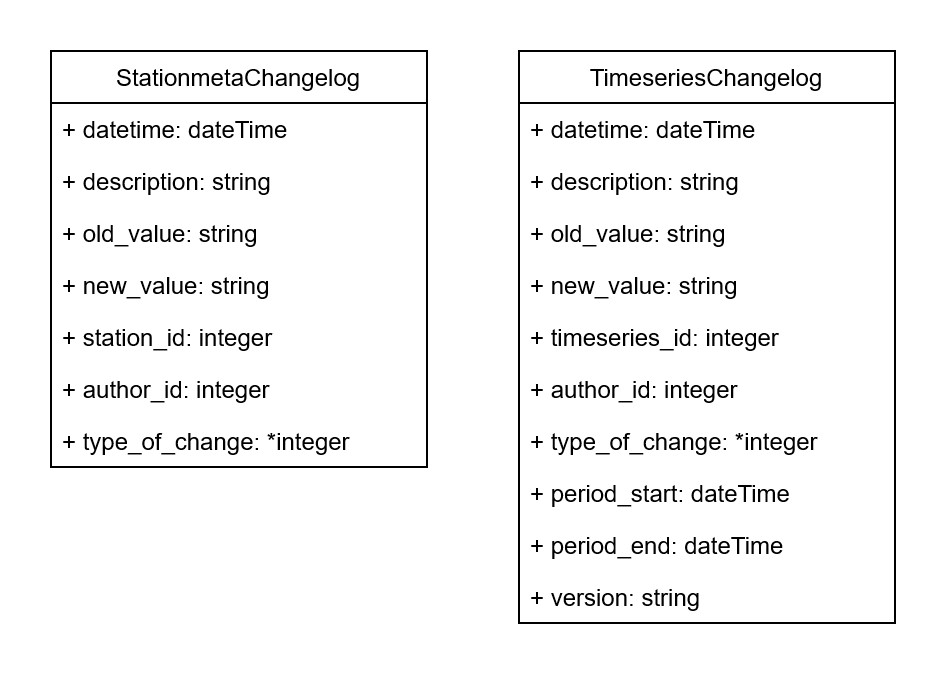
Fig. 4.4 Structure of StationmetaChangelog and TimeseriesChangelog records. Each Stationmeta or Timeseries entry may contain 1..N Changelog entries.
Value |
Name |
Description |
|---|---|---|
0 |
Created |
created |
1 |
SingleValue |
single value correction in metadata |
2 |
Comprehensive |
comprehensive metadata revision |
3 |
Typo |
typographic correction of metadata |
4 |
UnspecifiedData |
typographic correction of metadata |
5 |
Replaced |
replaced data with a new version |
6 |
Flagging |
data value flagging |
4.3.3. Time Series Versioning
Any modification to the data values of a TOAR time series leads to a new time series version number. Furthermore, as described above, all changes (except for the addition of near realtime data) are documented in a corresponding changelog entry.
The version numbers of TOAR time series follow the common triple notation major.minor.micro (see for example PEP440 of Python). For technical reasons, version strings are internally stored in a fixed length format (example 000001.000001.20200911100000). The TOAR REST API and web interfaces will display the version numbers in a truncated user-friendly form (1.1.2020-09-11T11:10:0000). As the example shows, we use the micro number to store a date label. This facilitates the handling of near realtime data, because it allows to preserve the information when the last modification was made to the time series without having to add a changelog entry for each value addition.
Preliminary data will always have a major version number of 0. Once data have been approved (or “validated”) by the data provider, the version number is at least 1. Any change in the major version number implies that at least 25% or one full year of the data were modified or replaced (this includes changes in the data quality flags). In practice, this occurs if we receive updates of entire time series or several years, or if data need to be re-calibrated. If new data are appended to an existing time series as a result of a new data submission, only the minor version number will be increased and the micro version number will be set to the modification date, regardless of the length of the new data fragment. As mentioned above, the addition of new near-realtime data samples only changes the micro version number. Changes to the version number occur automatically as part of the data ingestion workflow (see Automated Data Preparation). However, it is also possible that the TOAR data curators manually increase a time series version, for example after a thorough evaluation and data quality flagging exercise.
The data values of deprecated versions are preserved in a special table named ”data_archive”. There is currently no interface planned to allow users the reconstruction of time series corresponding to a specific version number. This requires manual intervention of the TOAR database curators. However, the main purpose of the time series version number is to allow comparisons between data downloaded at different times: if the version number has changed between two downloads, users can use the changelog information to find out what happened in the meantime and decide which version they should use for their analysis.
4.3.4. Provenance in Data Quality Flags
The TOAR data quality flags are explained in Section 5.2. In the context of provenance, it is only relevant to highlight the fact that the names of the quality flags contain a statement of what we as TOAR data curators have done to the data quality status (e.g. “_confirmed”). Table 5.2 in Section 5.2 contains detailed definitions of the data quality flags which explicitly describe whether a flag value has been set by the original data provider or by the TOAR data curators and document if the data quality flag value has been changed as a result of the TOAR data quality control procedures. We note that the flagging scheme allows the reconstruction of the original provider flagging with one exception: if validated data sent to us contains no flagging information, we first assume that all data are OK and modify the data quality flag only if our automated quality control routine detects suspicious or clearly erroneous features. It is thus not possible to reconstruct from the data in the database whether data was explicitly flagged as OK or simply not flagged at all.
4.3.5. Description of the Data Origin
The TOAR database contains air quality and meteorological observations as well as meteorological values from numerical weather models to allow for more elaborate analyses of ozone variability and changes. In the future, we may also add time series to the database which are generated through machine learning, for example to fill gaps in the measurement time series. It is therefore important to preserve information about the data source, i.e. whether data comes from a measurement, a numerical model, or a machine learning model. This is expressed in the metadata element data_origin_type, which can assume the values ‘measurement’ or ‘model’.
For the measurement of air pollutant concentrations and meteorological variables, many different methods exist. Air pollution experts are often interested in the details of the measurements, down to the specification of instrument manufacturer and model number. While such information is sometimes available from the data providers, there is no harmonisation of such metadata and we don’t have the resources to harmonize hundreds or thousands of individual instrument specifications. However, through use of the additional_metadata fields, it is possible to preserve any such information which is given to us. See the Annex: Header Template for an example how such information can be provided.
As there (at least so far) is less variation in the names of numerical models from which we extract data, the field data_origin will contain the name of the numerical model for such data. Currently, the allowed values for data_origin are thus ‘Instrument’ (for all kinds of measurements), ‘COSMOREA6’, and ‘ERA5’. Additional information, such as a model version number, may again be placed in the additional_metadata field of the time series metadata.
Other aspects of data origin, i.e. references to the data provider, are described in the section on role codes (Section 4.3.1).
4.4. Other Aspects of Time Series Metadata
4.4.1. Sampling Frequency and Aggregation
The primary sampling frequency of data in the TOAR database is hourly. However, the database allows to store data with other sampling frequencies to enable the inclusion of historic data, for example. The allowed values of the metadata field sampling_frequency in the time series description are:
Number |
Description |
Description 2 |
|---|---|---|
0 |
Hourly |
hourly |
1 |
ThreeHourly |
3-hourly |
2 |
SixHourly |
6-hourly |
3 |
Daily |
daily |
4 |
Weekly |
weekly |
5 |
Monthly |
monthly |
6 |
Yearly |
yearly |
7 |
Irregular |
irregular data samples of constant length |
8 |
Irregular2 |
irregular data samples of varying length |
As part of the data harmonisation performed by the TOAR data centre staff, data values may be processed to yield one of the data frequencies listed in Table 4.8 above. For example, the German UBA reports their data as 30-minute averages and there are other data providers who submit data at 15-minute intervals. When aggregation is performed as part of the data ingestion process, this is noted in the metadata field aggregation of the time series metadata. The default value for aggregation is None, i.e. (hourly) data have been inserted as they were provided. The pre-defined aggregation values are:
Number |
Description |
Description 2 |
|---|---|---|
0 |
Mean |
mean |
1 |
MeanOf2 |
mean of two values |
2 |
MeanOfWeek |
weekly mean |
3 |
MeanOf4Samples |
mean out of 4 samples |
4 |
MeanOfMonth |
monthly mean |
5 |
None |
none |
6 |
unknown |
unknown |
Note that most data values are in fact aggregates of values which were originally sampled with higher frequency. For example, ozone measurements are typically performed once per minute and the data are averaged over the reporting interval chosen by the data provider. The aggregation field of the TOAR database only describes any aggregation performed by the TOAR database team and provides no information about any data processing done by the provider.
4.4.2. Handling of Time / Time Zones
All timestamps in the database are stored in UTC. During the data ingestion process the timezone at source is converted to UTC. The support for extraction in local timezones is planned for the future.
Footnotes
- 1
TOAR V1 is described in Schultz, M. G. et al. (2017) Tropospheric Ozone Assessment Report: Database and Metrics Data of Global Surface Ozone Observations, Elem Sci Anth, 5, p.58. DOI: http://doi.org/10.1525/elementa.244
- 2
DIRECTIVE 2008/50/EC OF THE EUROPEAN PARLIAMENT AND OF THE COUNCIL of 21 May 2008 on ambient air quality and cleaner air for Europe, available from https://eur-lex.europa.eu/legal-content/EN/ALL/?uri=CELEX%3A32008L0050, last accessed: 11 Jul 2022
- 3
It happens sometimes that we must manually correct spelling, date formats or other information, before we can submit new data to our automated data ingestion workflow, which keeps track of all modifications. In these cases, not all changes made to the data are preserved, but the raw data files will be archived and can be made available for comparison.
- 4
https://standards.iso.org/iso/19115/resources/Codelists/gml/CI_RoleCode.xml